Session Breaker with Pivots and VWAP (Arjo)Session Breaker with Pivots and VWAP : A complete intraday trading toolkit in one clean indicator.
This indicator combines four powerful tools that help traders understand intraday bias with clarity and confidence.
It plots the previous day’s last 30-minute high/low box (IST: 15:00–15:30) , the first-hour anchored VWAP (IST: 09:15–10:15) , daily pivot levels , and ATR-based dynamic support/resistance .
Key Features:
• Custom Session High & Low (default 30-min opening range or any session you choose)
→ Visual colored box that instantly changes color when price breaks above the high (cyan) or below the low (purple)
→ The separate darker box shows the exact opening-range boundaries
• Previous Day Classic Pivot Points (PP, BC, TC) + previous session midpoint
→ Clean horizontal lines that auto-update every day
• Morning Session VWAP (default 09:15–10:15 or fully customizable)
→ Perfect reference for early trend strength
• Dynamic Support & Resistance channel based on 20 EMA ± 1×ATR
→ Shaded zones for quick visual context
How to use this tool
//---------------Morning behavior----------------------------
Scenario 1: Opening above previous 30-min high + above 1-hr VWAP
# Institutions were buying heavily in the last 30 minutes yesterday
# Fresh buying continues today above VWAP.
→ Strong bullish continuation day
Scenario 2: Opening inside yesterday's last 30 Mins range + rejecting 1-hr VWAP
# Price keeps oscillating around the first-hour VWAP
No strong buying/selling pressure
→ Expect sideways mean reversion
Scenario 3: Opening below yesterday's last 30-min low but reclaiming 1-hr VWAP.
Then moves towards yesterday’s midpoint or even high.
# Overnight panic selling is absorbed by institutions, then the market reverses. This is a high-probability reversal.
→ Short-covering rally
Scenario 4: Gap up into yesterday's last 30 Mins high and failing 1-hour VWAP
→ Ideal countertrend short.
Scenario 5: Opening below yesterday's last 30-minute low + below 1-hour VWAP
# Aggressive selling
# Staying below VWAP = no buyer strength
#Institutions are selling rallies into VWAP
→ Strong bearish continuation day
In Short:
1. Price opens ABOVE previous 30-min HIGH + stays ABOVE VWAP → TREND DAY UP
2. Price opens INSIDE the previous 30-min range + hovers around VWAP → RANGE / MEAN REVERSION DAY
3. Price opens BELOW previous 30-min LOW + reclaims VWAP → REVERSAL DAY UP (Short-Covering or Short Trap)
4. Gap up opens ABOVE previous 30-min HIGH + failing 1-hr VWAP → Countertrend short.
5. Price opens BELOW previous 30-min LOW + stays BELOW VWAP → TREND DAY DOWN
Disclaimer
This indicator is an analytical and educational tool . It does not provide buy/sell signals. Users may combine these concepts with their own trading approach and risk management.
Happy trading, ARJO.
"horizontal line"に関するスクリプトを検索
ueuito VWAP + VWAP Previous Day EndThis script is a fully featured VWAP indicator, based on the standard Volume-Weighted Average Price formula used by professional traders. It calculates the VWAP anchored to the selected period and also provides optional standard deviation or percentage-based bands.
In addition to the traditional VWAP logic, this version introduces an important enhancement:
⭐ Previous Day VWAP Closing Line (New Feature)
The script automatically calculates the final VWAP value of the previous trading day and plots it as a horizontal line at the start of each new session.
This line remains visible throughout the current day, allowing traders to quickly identify where the market closed relative to the VWAP on the prior day.
This added feature provides several advantages:
Highlights a key institutional reference level that is often used for mean-reversion setups.
Allows intraday traders to compare current price action with the previous session’s VWAP benchmark.
Helps identify support/resistance behavior around the prior VWAP close.
The line is customizable with options for:
Color
Width
Style (solid, dashed, dotted)
On/off toggle
✔ Summary of Features
Standard VWAP calculation with optional session or custom anchors
Three optional VWAP bands (standard deviation or percentage based)
Fully configurable appearance settings
Previous Day VWAP Closing Line added as a key enhancement
Works on any intraday timeframe
Automatically resets at the start of each trading session

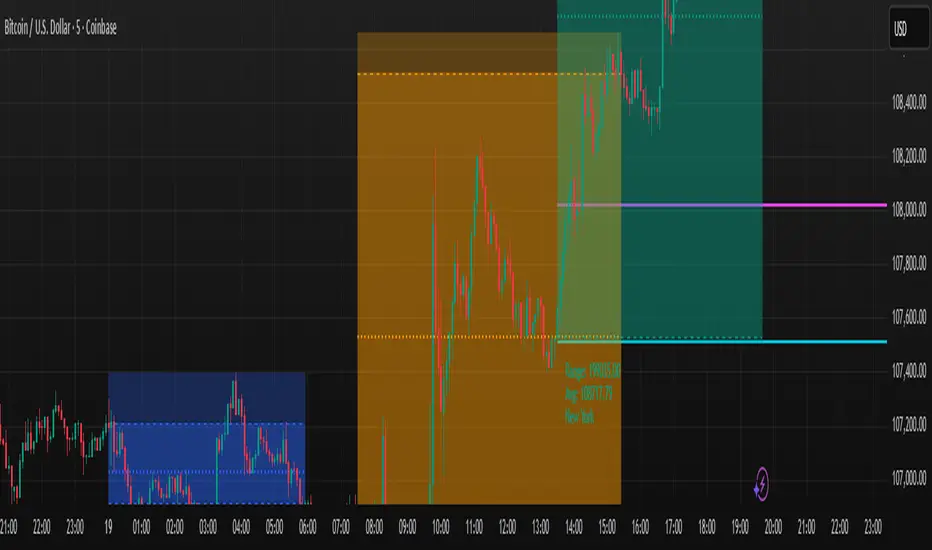
Forex Session TrackerForex Session Tracker - Professional Trading Session Indicator
The Forex Session Tracker is a comprehensive and visually intuitive indicator designed specifically for forex traders who need precise tracking of major global trading sessions. This powerful tool helps traders identify active market sessions, monitor session-specific price ranges, and capitalize on volatility patterns unique to each trading period.
Understanding when major financial centers are active is crucial for forex trading success. This indicator provides real-time visualization of the Tokyo, London, New York, and Sydney trading sessions, allowing traders to align their strategies with peak liquidity periods and avoid low-volatility trading windows.
---
Key Features
📊 Four Major Global Trading Sessions
The indicator tracks all four primary forex trading sessions with precision:
- Tokyo Session (Asian Market) - Captures the Asian trading hours, ideal for JPY, AUD, and NZD pairs
- London Session (European Market) - Monitors the most liquid trading period, perfect for EUR, GBP pairs
- New York Session (American Market) - Tracks US market hours, essential for USD-based currency pairs
- Sydney Session (Pacific Market) - Identifies the opening of the trading week and AUD/NZD activity
Each session is fully customizable with individual color schemes, making it easy to distinguish between different market periods at a glance.
🎯 Session Range Visualization
For each active trading session, the indicator automatically:
- Draws rectangular boxes that highlight the session's time period
- Tracks and displays session HIGH and LOW price levels in real-time
- Creates horizontal lines at session extremes for easy reference
- Positions session labels at the center of each trading period
- Updates dynamically as new highs or lows are formed within the session
This visual approach helps traders quickly identify:
- Session breakout opportunities
- Support and resistance zones formed during specific sessions
- Range-bound vs. trending session behavior
- Key price levels that institutional traders are watching
📱 Live Information Dashboard
A sleek, professional information panel displays:
- Real-time session status - Instantly see which sessions are currently active
- Color-coded indicators - Green dots for active sessions, gray for closed sessions
- Timezone information - Confirms your current timezone settings
- Customizable positioning - Place the dashboard anywhere on your chart (Top Left, Top Right, Bottom Left, Bottom Right)
- Adjustable size - Choose from Tiny, Small, Normal, or Large text sizes for optimal visibility
The dashboard provides at-a-glance awareness of market conditions without cluttering your chart analysis.
⚙️ Extensive Customization Options
Every aspect of the indicator can be tailored to your trading preferences:
Session-Specific Controls:
- Enable/disable individual sessions
- Customize colors for each trading period
- Adjust session times to match your broker's server time
- Toggle background highlighting on/off
- Show/hide session high/low lines independently
General Settings:
- UTC Offset Control - Adjust timezone from UTC-12 to UTC+14
- Exchange Timezone Option - Automatically use your chart's exchange timezone
- Background Transparency - Fine-tune the opacity of session highlighting (0-100%)
- Session Labels - Show or hide session name labels
- Information Panel - Toggle the live status dashboard on/off
Style Settings:
- Turn session backgrounds ON/OFF directly from the Style tab
- Maintain clean charts while keeping all analytical features active
🔔 Built-in Alert System
Stay informed about session openings with customizable alerts:
- Tokyo Session Started
- London Session Started
- New York Session Started
- Sydney Session Started
Set up notifications to never miss important market opening periods, even when you're away from your charts.
---
How to Use This Indicator
For Day Traders:
1. Identify High-Volatility Periods - Focus your trading during London and New York session overlaps for maximum liquidity
2. Monitor Session Breakouts - Watch for price breaks above/below session highs and lows
3. Avoid Low-Volume Periods - Recognize when major sessions are closed to avoid false signals
For Swing Traders:
1. Mark Key Levels - Use session highs and lows as support/resistance zones
2. Track Multi-Session Patterns - Observe how price behaves across different trading sessions
3. Plan Entry/Exit Points - Time your trades around session openings for better execution
For Currency-Specific Traders:
1. JPY Pairs - Focus on Tokyo session movements
2. EUR/GBP Pairs - Monitor London session activity
3. USD Pairs - Track New York session volatility
4. AUD/NZD Pairs - Watch Sydney and Tokyo sessions
---
Technical Specifications
- Pine Script Version: 5
- Overlay Indicator: Yes (displays directly on price chart)
- Maximum Bars Back: 500
- Drawing Objects: Up to 500 lines, boxes, and labels
- Performance: Optimized for real-time data processing
- Compatibility: Works on all timeframes (recommended: 5m to 1H for session tracking)
---
Installation & Setup
1. Add to Chart - Click "Add to Chart" after copying the script to Pine Editor
2. Configure Timezone - Set your UTC offset or enable "Use Exchange Timezone"
3. Customize Colors - Choose your preferred color scheme for each session
4. Adjust Display - Enable/disable features based on your trading style
5. Set Alerts - Create alert notifications for session starts
---
Best Practices
✅ Combine with Price Action - Use session ranges alongside candlestick patterns for confirmation
✅ Watch Session Overlaps - The London-New York overlap (1300-1600 UTC) typically shows highest volatility
✅ Respect Session Highs/Lows - These levels often act as intraday support and resistance
✅ Adjust for Your Broker - Verify session times match your broker's server clock
✅ Use Multiple Timeframes - View sessions on both lower (15m) and higher (1H) timeframes for context
---
Why Choose Forex Session Tracker Pro?
✨ Professional Grade Tool - Built with clean, efficient code following TradingView best practices
✨ Beginner Friendly - Intuitive design with clear visual cues
✨ Highly Customizable - Adapt every feature to match your trading style
✨ Performance Optimized - Lightweight code that won't slow down your charts
✨ Actively Maintained - Regular updates and improvements
✨ No Repainting - All visual elements are fixed once the session completes
---
Support & Updates
This indicator is designed to provide reliable, accurate session tracking for forex traders of all experience levels. Whether you're a scalper looking for high-volatility windows or a position trader marking key institutional levels, the Forex Session Tracker Pro delivers the insights you need to make informed trading decisions.
Happy Trading! 📈
---
Disclaimer
This indicator is a tool for technical analysis and should be used as part of a comprehensive trading strategy. Past performance does not guarantee future results. Always practice proper risk management and never risk more than you can afford to lose. Trading forex carries a high level of risk and may not be suitable for all investors.

Advanced Intraday Darvas BoxThis indicator applies a modern Darvas Box strategy for intraday traders, using non-repainting pivot detection combined with strong filters to reduce chart noise:
Confirmed swing highs and lows: Boxes only form when genuine swing pivots appear, ensuring fully non-repainting signals.
Minimum box height: Small, "noise" boxes are filtered out using ATR multiples for meaningful zones.
Trend filter: Choose EMA, SMA, or VWAP to lock boxes and breakouts to market direction.
Volume confirmation: Boxes are only confirmed when volume is above a user-defined threshold, highlighting high-participation moves.
Breakout filter: Signals trigger only if the breakout candle closes substantially beyond the box, reducing false breakouts.
Limited box display: Recent boxes only, keeping your chart clean and readable.
Features & Inputs
Pivot sensitivity: Set the number of bars for swing calculation.
Box filtering: Specify the minimum ATR multiple for box size.
Trend selection: EMA, SMA, VWAP, or None.
Volume filter & threshold: Activate for greater breakout confidence.
Breakout/Breakdown strength: Set how far price must close beyond the box to signal power.
Maximum boxes: Control the number of active boxes to keep the chart clear.
How to Add and Use
Add to Chart:
Click the “Add to Favorite Scripts” star to mark this indicator.
Open your desired intraday chart (1m–30m works best).
Click “Indicators,” search for “Advanced Intraday Darvas Box,” and add to your chart.
Customize Inputs:
Use the settings gear ⚙️ to adjust pivot sensitivity, trend logic, box filtering, and volume confirmation.
Lower minimum box height or pivot length for more frequent signals. Raise them for sparser, higher conviction setups.
Reading Darvas Boxes:
Box Edges: Horizontal lines mark resistance (top) and support (bottom) of detected zones.
Shaded regions: Highlight the most relevant trading zones and where price could coil before breakout.
Breakout labels (↑/↓): These appear only when price makes a powerful, confirmed move beyond the box edge—aligned with trend.
Alerts: Turn on chart alerts using the “Strong Bullish Breakout” or “Strong Bearish Breakdown” alert conditions for automated signal monitoring.
Best Practices:
Use Darvas boxes to complement price action analysis. Combine with candlestick patterns, volume spikes, and other price structure.
Only trade strong breakout signals confirmed by volume and market direction.
Avoid excessive boxes—adjust "Max Boxes" and filters for your instrument and timeframe.
Important
This indicator is non-repainting and built for display clarity and clean signals.
No brokerage automation, no external linking, and pure price/volume logic—fully compliant with TradingView House Rules.
Always test settings and confirmations before using for live decision-making.

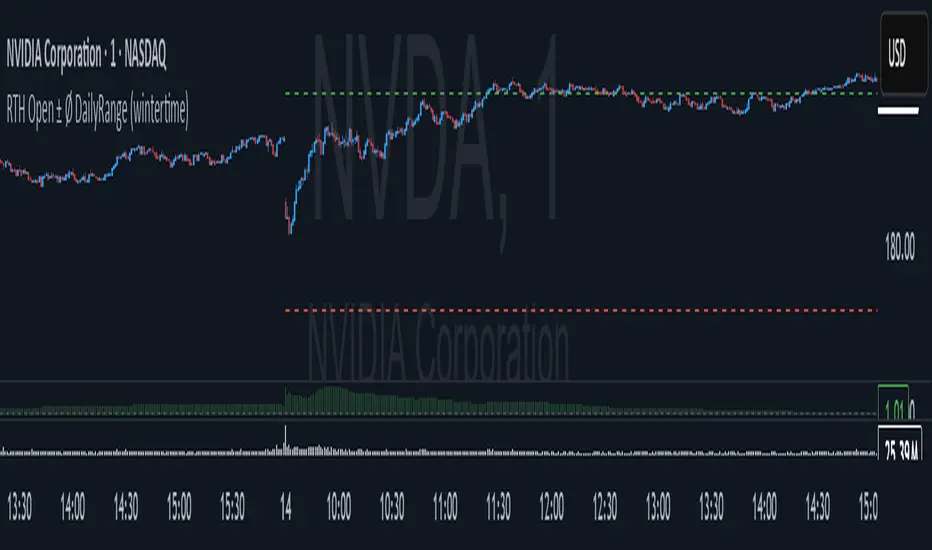
RTH Open ± Ø DailyRange (wintertime)verview
The script draws two horizontal lines on your chart based on the RTH Open (Regular Trading Hours start at 09:00 CET, winter time). These lines are offset by the average daily range (the average of the last 10 days’ high–low range). The lines begin at the first bar of the RTH session and extend dynamically to the current bar.
SP500 Session Gap Fade StrategySummary in one paragraph
SPX Session Gap Fade is an intraday gap fade strategy for index futures, designed around regular cash sessions on five minute charts. It helps you participate only when there is a full overnight or pre session gap and a valid intraday session window, instead of trading every open. The original part is the gap distance engine which anchors both stop and optional target to the previous session reference close at a configurable flat time, so every trade’s risk scales with the actual gap size rather than a fixed tick stop.
Scope and intent
• Markets. Primarily index futures such as ES, NQ, YM, and liquid index CFDs that exhibit overnight gaps and regular cash hours.
• Timeframes. Intraday timeframes from one minute to fifteen minutes. Default usage is five minute bars.
• Default demo used in the publication. Symbol CME:ES1! on a five minute chart.
• Purpose. Provide a simple, transparent way to trade opening gaps with a session anchored risk model and forced flat exit so you are not holding into the last part of the session.
• Limits. This is a strategy. Orders are simulated on standard candles only.
Originality and usefulness
• Unique concept or fusion. The core novelty is the combination of a strict “full gap” entry condition with a session anchored reference close and a gap distance based TP and SL engine. The stop and optional target are symmetric multiples of the actual gap distance from the previous session’s flat close, rather than fixed ticks.
• Failure mode it addresses. Fixed sized stops do not scale when gaps are unusually small or unusually large, which can either under risk or over risk the account. The session flat logic also reduces the chance of holding residual positions into late session liquidity and news.
• Testability. All key pieces are explicit in the Inputs: session window, minutes before session end, whether to use gap exits, whether TP or SL are active, and whether to allow candle based closes and forced flat. You can toggle each component and see how it changes entries and exits.
• Portable yardstick. The main unit is the absolute price gap between the entry bar open and the previous session reference close. tp_mult and sl_mult are multiples of that gap, which makes the risk model portable across contracts and volatility regimes.
Method overview in plain language
The strategy first defines a trading session using exchange time, for example 08:30 to 15:30 for ES day hours. It also defines a “flat” time a fixed number of minutes before session end. At the flat bar, any open position is closed and the bar’s close price is stored as the reference close for the next session. Inside the session, the strategy looks for a full gap bar relative to the prior bar: a gap down where today’s high is below yesterday’s low, or a gap up where today’s low is above yesterday’s high. A full gap down generates a long entry; a full gap up generates a short entry. If the gap risk engine is enabled and a valid reference close exists, the strategy measures the distance between the entry bar open and that reference close. It then sets a stop and optional target as configurable multiples of that gap distance and manages them with strategy.exit. Additional exits can be triggered by a candle color flip or by the forced flat time.
Base measures
• Range basis. The main unit is the absolute difference between the current entry bar open and the stored reference close from the previous session flat bar. That value is used as a “gap unit” and scaled by tp_mult and sl_mult to build the target and stop.
Components
• Component one: Gap Direction. Detects full gap up or full gap down by comparing the current high and low to the previous bar’s high and low. Gap down signals a long fade, gap up signals a short fade. There is no smoothing; it is a strict structural condition.
• Component two: Session Window. Only allows entries when the current time is within the configured session window. It also defines a flat time before the session end where positions are forced flat and the reference close is updated.
• Component three: Gap Distance Risk Engine. Computes the absolute distance between the entry open and the stored reference close. The stop and optional target are placed as entry ± gap_distance × multiplier so that risk scales with gap size.
• Optional component: Candle Exit. If enabled, a bullish bar closes short positions and a bearish bar closes long positions, which can shorten holding time when price reverses quickly inside the session.
• Session windows. Session logic uses the exchange time of the chart symbol. When changing symbols or venues, verify that the session time string still matches the new instrument’s cash hours.
Fusion rule
All gates are hard conditions rather than weighted scores. A trade can only open if the session window is active and the full gap condition is true. The gap distance engine only activates if a valid reference close exists and use_gap_risk is on. TP and SL are controlled by separate booleans so you can use SL only, TP only, or both. Long and short are symmetric by construction: long trades fade full gap downs, short trades fade full gap ups with mirrored TP and SL logic.
Signal rule
• Long entry. Inside the active session, when the current bar shows a full gap down relative to the previous bar (current high below prior low), the strategy opens a long position. If the gap risk engine is active, it places a gap based stop below the entry and an optional target above it.
• Short entry. Inside the active session, when the current bar shows a full gap up relative to the previous bar (current low above prior high), the strategy opens a short position. If the gap risk engine is active, it places a gap based stop above the entry and an optional target below it.
• Forced flat. At the configured flat time before session end, any open position is closed and the close price of that bar becomes the new reference close for the following session.
• Candle based exit. If enabled, a bearish bar closes longs, and a bullish bar closes shorts, regardless of where TP or SL sit, as long as a position is open.
What you will see on the chart
• Markers on entry bars. Standard strategy entry markers labeled “long” and “short” on the gap bars where trades open.
• Exit markers. Standard exit markers on bars where either the gap stop or target are hit, or where a candle exit or forced flat close occurs. Exit IDs “long_gap” and “short_gap” label gap based exits.
• Reference levels. Horizontal lines for the current long TP, long SL, short TP, and short SL while a position is open and the gap engine is enabled. They update when a new trade opens and disappear when flat.
• Session background. This version does not add background shading for the session; session logic runs internally based on time.
• No on chart table. All decisions are visible through orders and exit levels. Use the Strategy Tester for performance metrics.
Inputs with guidance
Session Settings
• Trading session (sess). Session window in exchange time. Typical value uses the regular cash session for each contract, for example “0830-1530” for ES. Adjust if your broker or symbol uses different hours.
• Minutes before session end to force exit (flat_before_min). Minutes before the session end where positions are forced flat and the reference close is stored. Typical range is 15 to 120. Raising it closes trades earlier in the day; lowering it allows trades later in the session.
Gap Risk
• Enable gap based TP/SL (use_gap_risk). Master switch for the gap distance exit engine. Turning it off keeps entries and forced flat logic but removes automatic TP and SL placement.
• Use TP limit from gap (use_gap_tp). Enables gap based profit targets. Typical values are true for structured exits or false if you want to manage exits manually and only keep a stop.
• Use SL stop from gap (use_gap_sl). Enables gap based stop losses. This should normally remain true so that each trade has a defined initial risk in ticks.
• TP multiplier of gap distance (tp_mult). Multiplier applied to the gap distance for the target. Typical range is 0.5 to 2.0. Raising it places the target further away and reduces hit frequency.
• SL multiplier of gap distance (sl_mult). Multiplier applied to the gap distance for the stop. Typical range is 0.5 to 2.0. Raising it widens the stop and increases risk per trade; lowering it tightens the stop and may increase the number of small losses.
Exit Controls
• Exit with candle logic (use_candle_exit). If true, closes shorts on bullish candles and longs on bearish candles. Useful when you want to react to intraday reversal bars even if TP or SL have not been reached.
• Force flat before session end (use_forced_flat). If true, guarantees you are flat by the configured flat time and updates the reference close. Turn this off only if you understand the impact on overnight risk.
Filters
There is no separate trend or volatility filter in this version. All trades depend on the presence of a full gap bar inside the session. If you need extra filtering such as ATR, volume, or higher timeframe bias, they should be added explicitly and documented in your own fork.
Usage recipes
Intraday conservative gap fade
• Timeframe. Five minute chart on ES regular session.
• Gap risk. use_gap_risk = true, use_gap_tp = true, use_gap_sl = true.
• Multipliers. tp_mult around 0.7 to 1.0 and sl_mult around 1.0.
• Exits. use_candle_exit = false, use_forced_flat = true. Focus on the structured TP and SL around the gap.
Intraday aggressive gap fade
• Timeframe. Five minute chart.
• Gap risk. use_gap_risk = true, use_gap_tp = false, use_gap_sl = true.
• Multipliers. sl_mult around 0.7 to 1.0.
• Exits. use_candle_exit = true, use_forced_flat = true. Entries fade full gaps, stops are tight, and candle color flips flatten trades early.
Higher timeframe gap tests
• Timeframe. Fifteen minute or sixty minute charts on instruments with regular gaps.
• Gap risk. Keep use_gap_risk = true. Consider slightly higher sl_mult if gaps are structurally wider on the higher timeframe.
• Note. Expect fewer trades and be careful with sample size; multi year data is recommended.
Properties visible in this publication
• On average our risk for each position over the last 200 trades is 0.4% with a max intraday loss of 1.5% of the total equity in this case of 100k $ with 1 contract ES. For other assets, recalculations and customizations has to be applied.
• Initial capital. 100 000.
• Base currency. USD.
• Default order size method. Fixed with size 1 contract.
• Pyramiding. 0.
• Commission. Flat 2 USD per order in the Strategy Tester Properties. (2$ buying + 2$selling)
• Slippage. One tick in the Strategy Tester Properties.
• Process orders on close. ON.
Realism and responsible publication
• No performance claims are made. Past results do not guarantee future outcomes.
• Costs use a realistic flat commission and one tick of slippage per trade for ES class futures.
• Default sizing with one contract on a 100 000 reference account targets modest per trade risk. In practice, extreme slippage or gap through events can exceed this, so treat the one and a half percent risk target as a design goal, not a guarantee.
• All orders are simulated on standard candles. Shapes can move while a bar is forming and settle on bar close.
Honest limitations and failure modes
• Economic releases, thin liquidity, and limit conditions can break the assumptions behind the simple gap model and lead to slippage or skipped fills.
• Symbols with very frequent or very large gaps may require adjusted multipliers or alternative risk handling, especially in high volatility regimes.
• Very quiet periods without clean gaps will produce few or no trades. This is expected behavior, not a bug.
• Session windows follow the exchange time of the chart. Always confirm that the configured session matches the symbol.
• When both the stop and target lie inside the same bar’s range, the TradingView engine decides which is hit first based on its internal intrabar assumptions. Without bar magnifier, tie handling is approximate.
Legal
Education and research only. This strategy is not investment advice. You remain responsible for all trading decisions. Always test on historical data and in simulation with realistic costs before considering any live use.

Consolidation Tracker🧭 Consolidation Tracker — Visualize Market Reversals in Real Time
The Consolidation Tracker is a minimalist yet powerful tool designed to map the anatomy of market reversals and trend transitions. It highlights the structural evolution of price through four key phases, helping traders anticipate shifts with clarity and confidence.
🔄 The Four Stages of a Market Reversal:
Failure to Displace — Price fails to break beyond recent highs or lows, signaling potential exhaustion of the current trend.
Consolidation (CAMP) — A range-bound phase where price compresses between a dynamic high and low. These zones are shaded gray, representing indecision and balance.
Engulfing (ENGULF) — A decisive candle closes beyond the CAMP high or low, suggesting a directional shift. These are highlighted in orange.
Fair Value Gap (FVG) — A three-candle pattern forms a price imbalance. If this FVG also engulfs the CAMP range, it confirms the reversal and resets the CAMP. Bullish FVGs are shaded green, bearish FVGs in red.
🔁 From Reversal to Trend:
Once a reversal is confirmed via an FVG, the market often transitions into a trend cycle characterized by:
Displacement — Strong directional movement away from the prior range.
Fair Value Gaps — Continuation imbalances that offer high-probability entries on retracements.
🧠 How It Works:
The indicator dynamically tracks CAMP highs and lows, updating only when a candle engulfs the range or a valid FVG forms.
FVGs are detected when a three-candle sequence creates a gap between candle 2 and 0, and the middle candle (candle 1) breaks the CAMP boundary.
CAMP levels are plotted as horizontal lines, while background colors narrate the evolving structure in real time.
This tool is ideal for traders who value market structure, price efficiency, and narrative clarity. Whether you're anticipating reversals or riding trends, the Consolidation Tracker offers a clean, actionable lens into price behavior.

Hourly High Low Short LinesDraws short horizontal lines at the previous hour’s high and low, aligned perfectly with the candle’s top and bottom.
It’s concise, clear, and fits well for the public script description box.

Multi Market Structure TrendOVERVIEW
Multi Market Structure Trend is a multi-layered market structure analyzer that detects trend shifts across five independent pivot-based structures . Each pivot uses a different lookback length, offering a comprehensive view of structural momentum from short-term to long-term.
The indicator visually displays the net trend direction using colored candlesticks and a dynamic gauge that tracks how many of the 5 market structure layers are currently bullish or bearish.
⯁ STRUCTURE TRACKING SYSTEM
The indicator tracks five separate market structure layers in parallel using pivot-based breakouts. Each one can be individually enabled or disabled.
Each structure works as follows:
A bullish MSB (Market Structure Break) occurs when price breaks above the most recent swing high.
A bearish MSB occurs when price breaks below the most recent swing low.
Structure breaks are plotted as horizontal lines and labeled with the number (1 to 5) corresponding to their pivot layer.
⯁ CANDLE COLOR GRADIENT SYSTEM
The indicator calculates the average directional bias from all enabled market structures to determine the current trend score.
Each structure contributes a score of +1 for bullish and -1 for bearish.
The total score ranges from -5 (all bearish) to +5 (all bullish) .
Candlesticks are colored using a smooth gradient:
Bright Green: Strong bullish trend (e.g., +5).
Orange: Neutral mixed trend (e.g., 0).
Red: Strong bearish trend (e.g., -5).
⯁ TREND GAUGE PANEL
Displayed at the middle-right side of the chart, the gauge shows the current trend strength in real time.
The bar consists of up to 10 gradient cells (5 up, 5 down).
Each active market structure pushes the score in one direction.
The central cell displays a numeric trend score:
+5 = All 5 market structures bullish
0 = Mixed/neutral trend
-5 = All 5 market structures bearish
Colors of the gauge bars match the candle gradient system.
⯁ USAGE
This indicator is highly effective for traders who want to:
Monitor short- and long-term structure shifts simultaneously on a single chart.
Use structure alignment as a trend confirmation tool — for example, waiting for at least 2 out of 5 structures to align before entering a trade.
Visually filter noise from different time horizons using the gauge and candle gradient.
Track CHoCH (Change of Character) transitions clearly and across multiple scales.
⯁ CONCLUSION
Multi Market Structure Trend offers a unique and powerful way to assess trend direction using stacked market structure logic. With five independently calculated structure layers, colored candle feedback, and a real-time trend gauge, traders can better time entries, filter noise, and confirm multi-timeframe alignment — all within a single chart overlay.

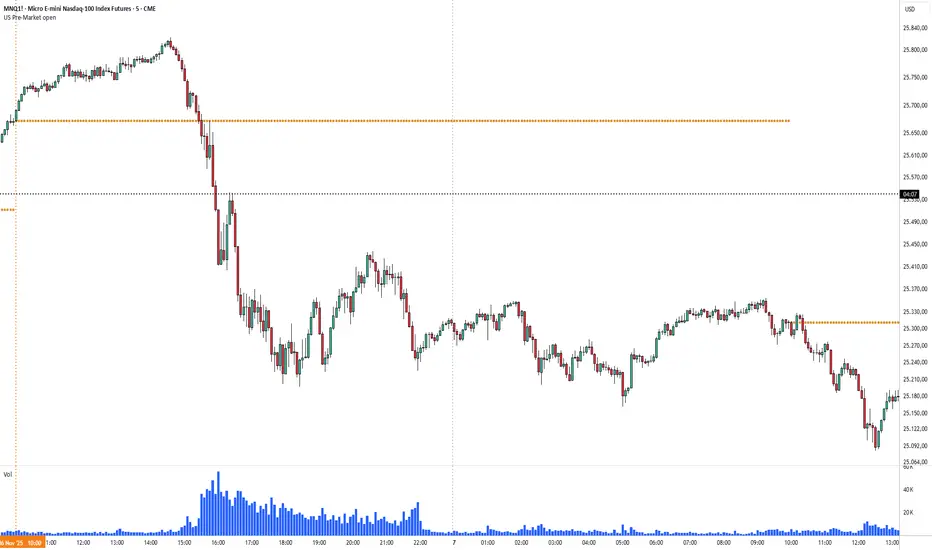
US Pre-Market open lineThis simple script draws a horizontal line on the candle from the US-Pre-Market Open at 10.00 a.m. (CET) / at 04.00 a.m. (NYT).
The colour, thickness and the style of the line can be changed.
It can help Price Action Traders to complete their strategy by the price action/reaction on the pre-market-opening resp. on the change of market overlapping.
[FS] Pivot Measurements# Pivot Measurements
An advanced TradingView indicator that combines LuxAlgo's pivot point detection algorithm with automatic measurement calculations between consecutive pivots.
## Features
### Pivot Detection
- **Regular Pivots**: Detects standard pivot highs and lows using configurable pivot length
- **Missed Pivots**: Identifies missed reversal levels that occurred between regular pivots
- **Visual Indicators**:
- Regular pivot highs: Red downward triangle (▼)
- Regular pivot lows: Teal upward triangle (▲)
- Missed pivots: Ghost emoji (👻)
- **Zigzag Lines**: Connects pivots with colored lines (solid for regular, dashed for missed)
- **Ghost Levels**: Horizontal lines indicating missed pivot levels
### Measurement System
- **Automatic Measurements**: Calculates price movements between consecutive pivots
- **Visual Display**:
- Transparent colored boxes (blue for upward, red for downward movements)
- Measurement labels showing:
- Price change (absolute and percentage)
- Duration (bars, days, hours, minutes)
- Volume approximation
- **Smart Positioning**: Labels positioned outside boxes (above for upward, below for downward)
- **Color Coding**: Blue for positive movements, red for negative movements
## Parameters
### Pivot Detection
- **Pivot Length** (default: 50): Number of bars on each side to identify a pivot point
- **Regular Pivots**: Toggle and colors for regular pivot highs and lows
- **Missed Pivots**: Toggle and colors for missed pivot detection
### Measurements
- **Number of Measurements** (1-10, default: 10): Maximum number of measurements to display
- **Show Measurement Boxes**: Toggle to show/hide measurement boxes and labels
- **Box Transparency** (0-100, default: 90): Transparency level for measurement boxes
- **Border Transparency** (0-100, default: 50): Transparency level for box borders
- **Label Background Transparency** (0-100, default: 30): Transparency level for label backgrounds
- **Label Size**: Size of measurement labels (tiny, small, normal, large)
## Usage
1. Add the indicator to your chart
2. Configure the **Pivot Length** based on your timeframe:
- Lower values for shorter timeframes (e.g., 10-20 for 1-5 min)
- Higher values for longer timeframes (e.g., 50-100 for daily)
3. Adjust pivot colors and visibility as needed
4. Customize measurement display settings:
- Set the number of measurements to display
- Adjust transparency levels for boxes, borders, and labels
- Choose label size
## Technical Details
- **Pine Script Version**: v6
- **Pivot Detection**: Based on () algorithm for detecting regular and missed pivots
- **Measurement Calculation**:
- Measures between consecutive pivots (from most recent to older)
- Calculates price change, percentage change, duration, and approximate volume
- Automatically sorts pivots chronologically
- **Performance**: Optimized with helper functions to reduce code duplication
## Notes
- The indicator automatically limits the number of stored pivots to optimize performance
- Measurements are only created when there are at least 2 pivots detected
- All measurements are recalculated on each bar update
- The indicator uses `max_bars_back=5000` to ensure sufficient historical data
## License
This indicator uses LuxAlgo's pivot detection algorithm from (). Please refer to the original LuxAlgo license for pivot detection components.

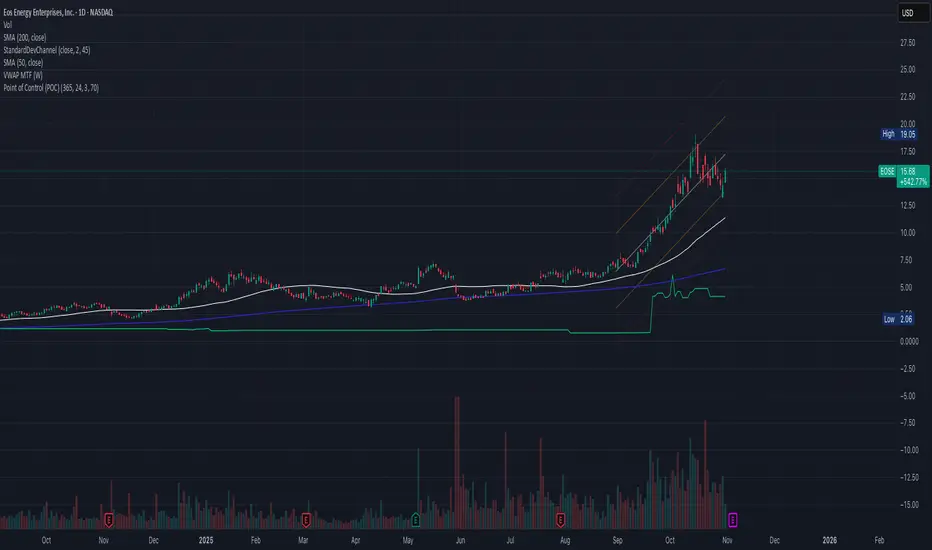
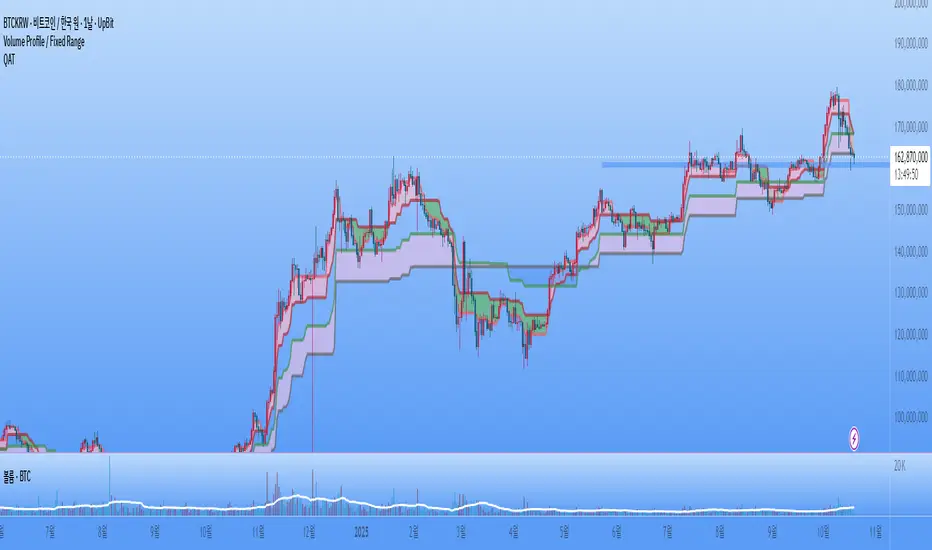
Point of Control (POC)**Point of Control (POC) Indicator**
This indicator identifies the price level where the most trading volume occurred over a specified lookback period (default: 365 days). The POC represents a significant support/resistance level where the market found the most acceptance.
**Key Features:**
- **POC Line**: Bright green horizontal line showing the highest volume price level
- **Volume Profile Analysis**: Divides price range into rows and calculates volume distribution
- **Value Area (Optional)**: Shows VAH and VAL levels containing 70% of total volume
- **Customizable**: Adjust lookback period, price resolution, colors, and line width
**How to Use:**
- POC acts as a magnet - price often returns to test these high-volume levels
- Strong support/resistance zone where significant trading activity occurred
- Useful for identifying key price levels for entries, exits, and stops
- Higher lookback periods (365 days) show longer-term significant levels
**Settings:**
- Lookback Period: Number of bars to analyze (default: 365)
- Price Rows: Calculation resolution - higher = more precise (default: 24)
- Toggle Value Area High/Low for additional context
---
London Ghost CandleCandle representation of the London session. 2am-5am NYT
By default the wicks is turned off because I only care about whether the session was green or red. You can add the wick, remove the open/close horizontal lines or even darken the colors in the settings. You can also remove the pane label box.
Hope it helps.

Standardization (Z-score)Standardization, often referred to as Z-score normalization, is a data preprocessing technique that rescales data to have a mean of 0 and a standard deviation of 1. The resulting values, known as Z-scores, indicate how many standard deviations an individual data point is from the mean of the dataset (or a rolling sample of it).
This indicator calculates and plots the Z-score for a given input series over a specified lookback period. It is a fundamental tool for statistical analysis, outlier detection, and preparing data for certain machine learning algorithms.
## Core Concepts
* **Standardization:** The process of transforming data to fit a standard normal distribution (or more generally, to have a mean of 0 and standard deviation of 1).
* **Z-score (Standard Score):** A dimensionless quantity that represents the number of standard deviations by which a data point deviates from the mean of its sample.
The formula for a Z-score is:
`Z = (x - μ) / σ`
Where:
* `x` is the individual data point (e.g., current value of the source series).
* `μ` (mu) is the mean of the sample (calculated over the lookback period).
* `σ` (sigma) is the standard deviation of the sample (calculated over the lookback period).
* **Mean (μ):** The average value of the data points in the sample.
* **Standard Deviation (σ):** A measure of the amount of variation or dispersion of a set of values. A low standard deviation indicates that the values tend to be close to the mean, while a high standard deviation indicates that the values are spread out over a wider range.
## Common Settings and Parameters
| Parameter | Type | Default | Function | When to Adjust |
| :-------------- | :----------- | :------ | :------------------------------------------------------------------------------------------------------ | :-------------------------------------------------------------------------------------------------------------------------------------------------------------------------- |
| Source | series float | close | The input data series (e.g., price, volume, indicator values). | Choose the series you want to standardize. |
| Lookback Period | int | 20 | The number of bars (sample size) used for calculating the mean (μ) and standard deviation (σ). Min 2. | A larger period provides more stable estimates of μ and σ but will be less responsive to recent changes. A shorter period is more reactive. `minval` is 2 because `ta.stdev` requires it. |
**Pro Tip:** Z-scores are excellent for identifying anomalies or extreme values. For instance, applying Standardization to trading volume can help quickly spot days with unusually high or low activity relative to the recent norm (e.g., Z-score > 2 or < -2).
## Calculation and Mathematical Foundation
The Z-score is calculated for each bar as follows, using a rolling window defined by the `Lookback Period`:
1. **Calculate Mean (μ):** The simple moving average (`ta.sma`) of the `Source` data over the specified `Lookback Period` is calculated. This serves as the sample mean `μ`.
`μ = ta.sma(Source, Lookback Period)`
2. **Calculate Standard Deviation (σ):** The standard deviation (`ta.stdev`) of the `Source` data over the same `Lookback Period` is calculated. This serves as the sample standard deviation `σ`.
`σ = ta.stdev(Source, Lookback Period)`
3. **Calculate Z-score:**
* If `σ > 0`: The Z-score is calculated using the formula:
`Z = (Current Source Value - μ) / σ`
* If `σ = 0`: This implies all values in the lookback window are identical (and equal to the mean). In this case, the Z-score is defined as 0, as the current source value is also equal to the mean.
* If `σ` is `na` (e.g., insufficient data in the lookback period), the Z-score is `na`.
> 🔍 **Technical Note:**
> * The `Lookback Period` must be at least 2 for `ta.stdev` to compute a valid standard deviation.
> * The Z-score calculation uses the sample mean and sample standard deviation from the rolling lookback window.
## Interpreting the Z-score
* **Magnitude and Sign:**
* A Z-score of **0** means the data point is identical to the sample mean.
* A **positive Z-score** indicates the data point is above the sample mean. For example, Z = 1 means the point is 1 standard deviation above the mean.
* A **negative Z-score** indicates the data point is below the sample mean. For example, Z = -1 means the point is 1 standard deviation below the mean.
* **Typical Range:** For data that is approximately normally distributed (bell-shaped curve):
* About 68% of Z-scores fall between -1 and +1.
* About 95% of Z-scores fall between -2 and +2.
* About 99.7% of Z-scores fall between -3 and +3.
* **Outlier Detection:** Z-scores significantly outside the -2 to +2 range, and especially outside -3 to +3, are often considered outliers or extreme values relative to the recent historical data in the lookback window.
* **Volatility Indication:** When applied to price, large absolute Z-scores can indicate moments of high volatility or significant deviation from the recent price trend.
The indicator plots horizontal lines at ±1, ±2, and ±3 standard deviations to help visualize these common thresholds.
## Common Applications
1. **Outlier Detection:** Identifying data points that are unusual or extreme compared to the rest of the sample. This is a primary use in financial markets for spotting abnormal price moves, volume spikes, etc.
2. **Comparative Analysis:** Allows for comparison of scores from different distributions that might have different means and standard deviations. For example, comparing the Z-score of returns for two different assets.
3. **Feature Scaling in Machine Learning:** Standardizing features to have a mean of 0 and standard deviation of 1 is a common preprocessing step for many machine learning algorithms (e.g., SVMs, logistic regression, neural networks) to improve performance and convergence.
4. **Creating Normalized Oscillators:** The Z-score itself can be used as a bounded (though not strictly between -1 and +1) oscillator, indicating how far the current price has deviated from its moving average in terms of standard deviations.
5. **Statistical Process Control:** Used in quality control charts to monitor if a process is within expected statistical limits.
## Limitations and Considerations
* **Assumption of Normality for Probabilistic Interpretation:** While Z-scores can always be calculated, the probabilistic interpretations (e.g., "68% of data within ±1σ") strictly apply to normally distributed data. Financial data is often not perfectly normal (e.g., it can have fat tails).
* **Sensitivity of Mean and Standard Deviation to Outliers:** The sample mean (μ) and standard deviation (σ) used in the Z-score calculation can themselves be influenced by extreme outliers within the lookback period. This can sometimes mask or exaggerate the Z-score of other points.
* **Choice of Lookback Period:** The Z-score is highly dependent on the `Lookback Period`. A short period makes it very sensitive to recent fluctuations, while a long period makes it smoother and less responsive. The appropriate period depends on the analytical goal.
* **Stationarity:** For time series data, Z-scores are calculated based on a rolling window. This implicitly assumes some level of local stationarity (i.e., the mean and standard deviation are relatively stable within the window).

FU Candle Detector (Smart Money Concept) En Anglais🧠 Overall concept: “FU Candle” in Smart Money logic
In the context of Smart Money Concepts (SMC) or ICT (Inner Circle Trader), an FU Candle (also known as a “Fakeout Candle” or “Manipulation Candle”) is a candle that:
Creates an imbalance or a break (often above a swing high or below a swing low),
Attracts liquidity by trapping retail traders (liquidity grab),
Then abruptly reverses direction, revealing the hand of “Smart Money” (large institutions).
It therefore often marks:
The point of manipulation before an impulsive movement (reversal),
An area of interest for entering in the institutional direction (after the liquidity grab).
---
⚙️ How the “FU Candle Detector” script works
The script identifies these candlesticks by observing several typical criteria:
1. Detection of the manipulative candle (FU Candle)
Search for a candlestick that breaks a previous swing (significant high or low),
But closes in the opposite direction, often below/above the broken zone,
Thus indicating a fakeout.
Examples:
Bullish FU Candle: breaks a previous low, but closes bullish.
Bearish FU Candle: breaks a previous high, but closes bearish.
---
2. Visualization on the chart
The script generally displays:
🔴 Red markers for bearish FUs (Fake Breakout upwards),
🟢 Green markers for bullish FUs (Fake Breakout downwards),
🟦 Rectangles of areas of interest (often around the FU Candle Open),
📏 Horizontal lines on areas of imbalance (OB/FVG if integrated).
---
3. Possible additions depending on the version
Depending on the version you have received, the script can also:
Detect Fair Value Gaps (FVG) around FU Candles,
Mark Order Blocks (OB) associated with manipulation,
Add alerts when new FU Candles are detected,
Calculate the distance between the manipulation point and the price return,
Filter according to candle size, volume, or market structure (MSB/CHoCH).
---
🎯 Practical use
FU Candles are often used:
As confirmation of an imminent reversal,
To identify institutional entry zones (hidden Order Block),
To anticipate the direction of the next impulse after the liquidity hunt.
Typical entry example:
> Wait for the formation of an FU Candle + price return within the candle body = entry in the opposite direction to the false breakout.
📈 Recommended combinations
This detector is often combined with:
Structure Break Indicator (CHoCH / BOS)
Liquidity Pool Zones
Fair Value Gap Finder
Order Block Detector
This gives you a complete Smart Money Concept system, capable of mapping:
1. Where liquidity has been taken,
2. Where the price is rebalancing,
3. Where Smart Money is repositioning its orders.

First X Days Of A YearFirst X-Day Indicator
Overview
The "First X-Day Indicator" is a powerful tool to visualize and analyze market sentiment during the crucial first trading days of each new year. It provides immediate visual feedback on whether the year is starting with positive or negative momentum compared to the previous year's close, a concept often related to market theories like the "January Effect" or the "First Five Days Rule."
The indicator is designed to be clean, intuitive, and fully customizable to fit your charting style.
Key Features
Yearly Baseline: Automatically draws a horizontal line at the previous year's closing price. This line serves as a clear 0% reference for the current year's performance.
Dynamic Background Coloring: For a user-defined number of days at the start of the year, the chart background is colored daily. Green indicates the close is above the previous year's close, while red indicates it's below.
Final Performance Symbol: At the end of the analysis period (e.g., on the 5th day), a single summary symbol (like 👍 or 👎) appears. This symbol represents the final performance outcome of the initial trading period.
Settings & Customization
You have full control over all visual elements:
Analysis Period: Define exactly how many days at the start of the year you want to analyze (e.g., 3, 5, or 10 days).
Line Customization: Fully control the yearly baseline's appearance. You can change its color, width, and style (Solid, Dashed, or Dotted) or hide it completely.
Symbol Customization: Choose any character or emoji for the positive and negative performance symbols. You can also adjust their size (Small, Normal, Large) or hide them.
Background Control: Enable or disable the daily background coloring and select your preferred custom colors for positive and negative days.

Custom Drawdown LevelsInput fields for three custom percentages.
Calculation of drawdown levels from the all-time high.
Plotting horizontal lines at those levels.

Puell Multiple Variants [OperationHeadLessChicken]Overview
This script contains three different, but related indicators to visualise Bitcoin miner revenue.
The classical Puell Multiple : historically, it has been good at signaling Bitcoin cycle tops and bottoms, but due to the diminishing rewards miners get after each halving, it is not clear how you determine overvalued and undervalued territories on it. Here is how the other two modified versions come into play:
Halving-Corrected Puell Multiple : The idea is to multiply the miner revenue after each halving with a correction factor, so overvalued levels are made comparable by a horizontal line across cycles. After experimentation, this correction factor turned out to be around 1.63. This brings cycle tops close to each other, but we lose the ability to see undervalued territories as a horizontal region. The third variant aims to fix this:
Miner Revenue Relative Strength Index (Miner Revenue RSI) : It uses RSI to map miner revenue into the 0-100 range, making it easy to visualise over/undervalued territories. With correct parameter settings, it eliminates the diminishing nature of the original Puell Multiple, and shows both over- and undervalued revenues correctly.
Example usage
The goal is to determine cycle tops and bottoms. I recommend using it on high timeframes, like monthly or weekly . Lower than that, you will see a lot of noise, but it could still be used. Here I use monthly as the example.
The classical Puell Multiple is included for reference. It is calculated as Miner Revenue divided by the 365-day Moving Average of the Miner Revenue . As you can see in the picture below, it has been good at signaling tops at 1,3,5,7.
The problems:
- I have to switch the Puell Multiple to a logarithmic scale
- Still, I cannot use a horizontal oversold territory
- 5 didn't touch the trendline, despite being a cycle top
- 9 touched the trendline despite not being a cycle top
Halving-Corrected Puell Multiple (yellow): Multiplies the Puell Multiple by 1.63 (a number determined via experimentation) after each halving. In the picture below, you can see how the Classical (white) and Corrected (yellow) Puell Multiples compare:
Advantages:
- Now you can set a constant overvalued level (12.49 in my case)
- 1,3,7 are signaled correctly as cycle tops
- 9 is correctly not signaled as a cycle top
Caveats:
- Now you don't have bottom signals anymore
- 5 is still not signaled as cycle top
Let's see if we can further improve this:
Miner Revenue RSI (blue):
On the monthly, you can see that an RSI period of 6, an overvalued threshold of 90, and an undervalued threshold of 35 have given historically pretty good signals.
Advantages:
- Uses two simple and clear horizontal levels for undervalued and overvalued levels
- Signaling 1,3,5,7 correctly as cycle tops
- Correctly does not signal 9 as a cycle top
- Signaling 4,6,8 correctly as cycle bottoms
Caveats:
- Misses two as a cycle bottom, although it was a long time ago when the Bitcoin market was much less mature
- In the past, gave some early overvalued signals
Usage
Using the example above, you can apply these indicators to any timeframe you like and tweak their parameters to obtain signals for overvalued/undervalued BTC prices
You can show or hide any of the three indicators individually
Set overvalued/undervalued thresholds for each => the background will highlight in green (undervalued) or red (overvalued)
Set special parameters for the given indicators: correction factor for the Corrected Puell and RSI period for Revenue RSI
Show or hide halving events on the indicator panel
All parameters and colours are adjustable

Trading Sessions with 15 minute ORBA working copy of the original Tradingview trading sessions indicator with the addition of horizontal lines marking the 15 minute opening range for your ORB strategy. The lines reset with each session start.
Master Trend Strategy - by jake_thebossMaster Trend Strategy
This strategy combines multiple technical indicators to identify high-probability trend entries across all asset classes.
Core Signal Logic:
Entry triggered when EMA 4 crosses above/below EMA 5
Confirmation required from RSI (>50 for long, <50 for short)
Price must be above/below key moving averages: EMA 21, SMA 50, EMA 55, EMA 89, and EMA 750
Additional confirmation from Stochastic (>52 bullish, <48 bearish) or EMA 89 breakout or VWAP cross
Key Features:
VWAP filter: Only takes bullish signals above VWAP and bearish signals below VWAP
Optional pyramiding: Allows multiple entries in the same direction (up to 200 orders)
Individual stop loss and take profit management for each pyramid level
Time filter: Customizable trading hours with timezone offset
Risk management: Adjustable stop loss (default 0.3%) and take profit (default 0.6%)
Visualization:
Entry, stop loss, and take profit levels drawn as horizontal lines
Customizable signal markers (triangles) for bull/bear entries
Optional EMA overlay display
The strategy is designed for trend-following on lower timeframes, with strict multi-indicator confirmation to filter out false signals.

Quadruple AlphaTrendKivancOzbilgi's 'Alpha Trend' indicator has been developed as 'Quadruple Alpha Trend'.
It has been extended to AlphaTrend1,2,3,4, and each line allows users to freely choose colors.
Each of the AT1 to 2 and AT3 to 4 was again color-transformed at the crossing point, respectively.
We believe that the value of AT can compensate a lot for all the shortcomings of a regular moving average.
It can show the support and resistance of the low and high points at each horizontal section and
pressed neck point at the same time
Draw a horizontal line type.
These advantages make it easy to visually break through and collapse support and resistance on the monthly, weekly, and daily charts
It makes it possible to distinguish. I think it's an excellent indicator design by Kivanc Ozbilgi.
The most similar indicator to this one is the "UT BOT", which is close to the moving average in terms of support and resistance
Because it gives a euphemism, the value of "Alpha Trend" as an index that includes horizontal support and resistance
Very highly appreciated. If you have any issues or need to develop further, please leave a note.
HTF Control Shift + Prev Candle Break Sequence 🧭 HTF Control Shift + Previous Candle Break Sequence
Overview
The HTF Control Shift + Previous Candle Break Sequence indicator identifies high-probability shift candles that suggest a potential change in market control — from sellers to buyers or vice versa — and then tracks whether price confirms that shift by breaking the previous candle’s high or low.
This tool is designed to help traders detect institutional control shifts and confirm them with price structure breaks, providing a framework for spotting early trend reversals or strong continuation moves.
How It Works
Control Shift Candle Detection
A Bullish Control Shift occurs when a candle shows:
A long lower wick (≥ Wick % Threshold of total range).
A close near the high (within Body % Threshold of the top).
A Bearish Control Shift occurs when a candle shows:
A long upper wick (≥ Wick % Threshold of total range).
A close near the low (within Body % Threshold of the bottom).
These candles are highlighted in green (bullish) or red (bearish), and optionally labeled on the chart.
Previous Candle High/Low Tracking
The script automatically plots horizontal lines at the previous candle’s high (green) and low (red).
These act as key reference levels for breakout confirmation.
Breakout Confirmation Sequence
A Bullish Sequence triggers when a Bullish Control Shift candle is followed by a break above the previous candle’s high.
A Bearish Sequence triggers when a Bearish Control Shift candle is followed by a break below the previous candle’s low.
When either sequence completes, the indicator can send a TradingView alert confirming the directional breakout.
How to Use
Timeframe:
Optimized for higher timeframes (1H, 4H, Daily) to filter out intraday noise and identify structural market shifts.
Trend Reversal Identification:
Watch for Control Shift candles at major highs/lows, order blocks, or liquidity zones — a confirmed breakout often signals a trend reversal or new directional push.
Continuation Confirmation:
In trending markets, a Control Shift candle that breaks in the direction of trend can validate a strong continuation setup.
Alert Usage:
Set alerts for:
Bullish Control Shift Confirmed Breakout
Bearish Control Shift Confirmed Breakdown
Optional: raw Control Shift or Break alerts.
Customization
Wick % Threshold: Adjusts the required wick size to define a control shift.
Body % Threshold: Controls how close the close must be to the high/low for confirmation.
Label Toggle: Optionally display labels only on control shift candles.
Best Practices
Combine with higher-timeframe trend filters.
Avoid using it alone in tight consolidation zones.
Strongest signals occur when:
Control Shift appears at key structure levels.
The breakout bar closes firmly beyond the previous high/low.
Volume supports the breakout.
Summary
✅ Detects when market control flips (buyers ↔ sellers).
✅ Confirms shift with breakout above/below previous candle.
✅ Ideal for 1H–4H swing or position trading.
✅ Provides visual, structural, and alert-based confirmation.

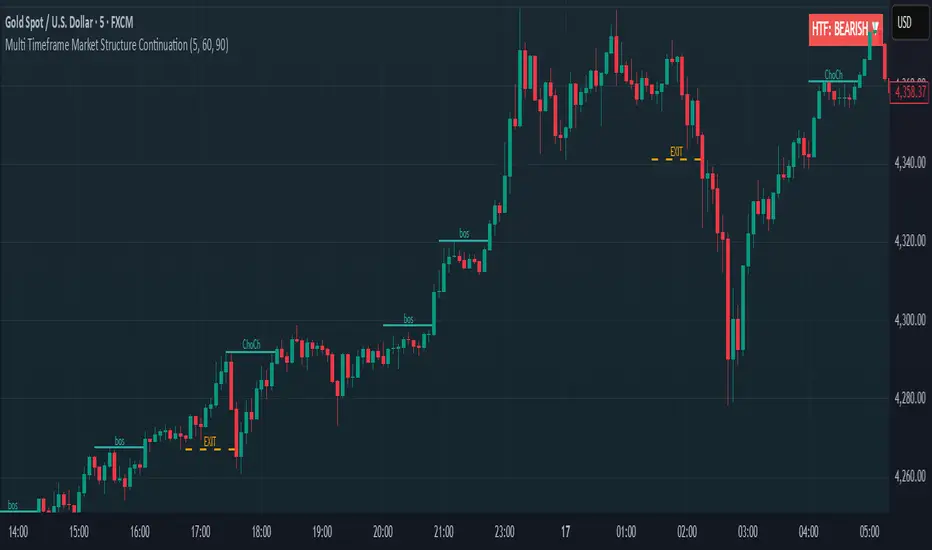
Multi Timeframe Market Structure ContinuationOverview
This indicator identifies Break of Structure (BOS) and Change of Character (ChoCh) patterns using multi-timeframe (MTF) analysis to filter high-probability trade setups. By aligning lower timeframe signals with higher timeframe bias, it helps traders enter positions in the direction of the dominant trend while avoiding counter-trend traps.
Multi-Timeframe Analysis
The indicator analyzes market structure on two timeframes simultaneously:
Current Timeframe (CTF): Detects immediate BOS and ChoCh signals for entry timing
Higher Timeframe (HTF): Establishes the overall trend direction (default: 1H, customizable)
Signals only appear when the current timeframe structure aligns with the higher timeframe bias, ensuring you're trading with the momentum, not against it.
Break of Structure (BOS)
BOS signals indicate trend continuation - when price breaks a previous high in an uptrend or a previous low in a downtrend. These are reliable entries that confirm the trend is still active and strong.
Change of Character (ChoCh)
ChoCh signals mark early trend reversals - when market structure shifts from bearish to bullish (or vice versa). When captured in alignment with the higher timeframe trend, ChoCh entries can achieve exceptional risk-to-reward ratios as they allow entry near the beginning of a new impulse move.
Exit Signals
Exit signals are plotted when a ChoCh occurs in the opposite direction of the HTF trend. For example, if the HTF is bullish and a bearish ChoCh forms on the current timeframe, an orange "EXIT" signal appears - warning long traders that the lower timeframe structure is shifting against them. This provides an early warning system to protect profits or minimize losses before the HTF trend itself reverses.
Trading Strategy Recommendations
Trending Markets (Recommended)
In strong trending conditions, both BOS and ChoCh signals can be taken when aligned with the HTF bias. ChoCh entries are particularly powerful as they catch early reversals within the larger trend, offering entries with tight stop losses and extended profit targets.
Ranging Markets
During consolidation or choppy conditions, it's best to be selective and take only BOS entries. BOS signals confirm that the trend is continuing beyond the range, reducing false breakouts and whipsaw trades that are common with counter-trend ChoCh signals in sideways markets.
Customization
Pivot Length: Adjust the sensitivity of structure detection (default: 5). Lower values detect structure more frequently with earlier but potentially noisier signals. Higher values provide cleaner, more significant structural breaks but with some delay.
Higher Timeframe: Customize the HTF to suit your trading style. Day traders might use 1H HTF on 5m charts, while swing traders could use 4H or Daily HTF.
Alert System
Six alert conditions available:
Long BOS Entry / Long ChoCh Entry
Short BOS Entry / Short ChoCh Entry
Long Exit / Short Exit
All alerts fire only on confirmed candle closes to eliminate repainting and false signals.
Visual Features
Color-coded background showing HTF bias
Clear BOS/ChoCh labels with horizontal lines at structure levels
Orange "EXIT" signals when structure breaks against your position
Gray lines tracking current swing highs/lows
HTF trend indicator in the top-right corner